
Comparing Web Form Builders by Carbon Footprint (Yes, It Matters)
When you hear "carbon footprint" you probably think of airplanes or factories, not about filling in a contact form on the last website you just visited. Yet, the internet currently produces 3.7% of worldwide greenhouse gases. To put that into perspective, this is roughly equivalent to the global aviation industry!
Thankfully, reducing the internet's carbon footprint through sustainable digital design is increasingly gaining traction. In this article we'll explore how web forms contribute to the internet's carbon impact. We will also help you pick the most sustainable web form tool for your needs, based on our extensive research.
Websites and Their Carbon Emissions
Visiting a simple web page involves multiple components, each consuming electricity. From your own device to the networks and data centers that deliver the content, every step requires energy and contributes, to varying degrees, to greenhouse gas emissions.
You might think that in the grand scheme of things these emissions are probably not that much. However, the average internaut's online activity generates 229kg of CO₂ per year. If we want to limit global warming to 1.5°C (which we would highly recommend!) then this internet activity alone accounts for 41% of a person's annual carbon budget.

What Impacts your Website's Carbon Footprint
Not all web pages are created equal. Some load in the blink of an eye, while others feel like they’re dragging an anchor. However, this isn't only about user experience.
The way a website is built directly affects how many resources it consumes. Here's a short overview of the impacting factors:
Data center and hosting. A website needs to "live" somewhere, and the efficiency of that hosting environment contributes a lot to its carbon footprint. In fact, green hosting providers can reduce a website's footprint up to 90%.
File size and media usage. Uncompressed images and videos will bog down a website, make it slower to load and increase its footprint. Techniques like compression (reducing files to under 200 KB) and lazy loading (delaying offscreen images) are therefore essential in building sustainable websites.
Code efficiency and reliance on scripts. Bloated code and excessive use of scripts also increase a website's energy intensity. Each script will need to be executed by the end user's computer, costing additional resources. Minifying a website's source code can reduce page weight, while eliminating unused scripts (e.g., non-critical tracking pixels) further trims energy demands.
The Role of Web Forms in Digital Sustainability
There is plenty of information available about digital sustainability in the context of websites. However, while researching this article, we focused on a specific question: What role do web forms and surveys play in digital sustainability? They may seem insignificant, but they are everywhere. From sign-ups and surveys to checkout pages and customer feedback forms. And like every other part of a website, they have an environmental impact.
Typeform alone has generated 2.9 billion form responses. With an average emission of 0.234 grams of CO₂ per form load (see our research below), this amounts to approximately 679 tonnes of CO₂ produced by Typeform forms alone. To put that into perspective, Typeform accounts for roughly 10% of the web form and survey market.
How we Measured and Compared the Carbon Emissions of Form Builders
In research, data is only as reliable as the methodology used to collect it. To ensure reproducibility and transparency, we’ll first explain our methodology before diving into the results.
What we Measured, and Why
Digital forms indirectly generate carbon emissions at three points in their life cycle. First, when they are created using a form-building tool (e.g. Google Forms, Typeform). Second, each time a respondent loads in the form. Third, when the collected data is processed for insights. In our research we exclusively focused on the footprint of the second step (i.e. emissions generated by loading web forms in a browser).
The reason for this is twofold. First, research has repeatedly shown that the usage phase of ICT products dwarfs the one-time creation phase when it comes to carbon emissions. Second, from a practical perspective it is impossible to adequately assess an online platform's digital emissions without full access to its source code and technological stack. In contrast, website carbon calculators are readily available to assess the footprint of online media (i.e. websites, web forms, etc.).
How we Conducted Measurements

This is the first time a study like this has been conducted, and we weren’t sure whether the different features in form builders (e.g. conditional logic, media elements, etc.) would significantly impact the carbon impact of the forms they generate. To find out, we created five distinct form types for each tool and measured their emissions:
T1: a simple contact form (arguably the most common use case for forms) asking for name and email details together with some additional meta information. An example of a T1 form is shown in the image above.
T2: a single-page form containing a varied set of form elements. We based this form on the lowest common denominator: Google Forms. This includes text-based questions, ratings, scales, checkboxes, radio buttons, dropdowns and a date picker.
T3: a multi-page variant of T2 which separates the question across three distinct pages.
T4: a single-page form containing various multi-media elements: two pictures and an embedded YouTube video.
T5: a variant of T3 which uses conditional logic to determine the flow between pages.
We implemented each of these five types of forms for ten of the most popular formand survey-building tools available:
We made use of three of the best regarded website carbon calculators: Website Carbon Calculator (from Wholegrain Digital), Digital Beacon (by Aline) and WebPageTest (by Catchpoint). We ran each form type, for each form builder, through the three tools. We ensured that we did this on the same day, from the same device and location in order to account for potential CDN optimisations behind the scenes.
Carbon Footprint of Popular Form-Building Tools
Our experiments served to answer two main questions. First, which functionalities of a form or survey impact energy consumption? Second, are there clear differences between form-building tools when it comes to carbon footprint? Let's dive into the results to answer these questions.
Does Form Functionality Impact Emissions?
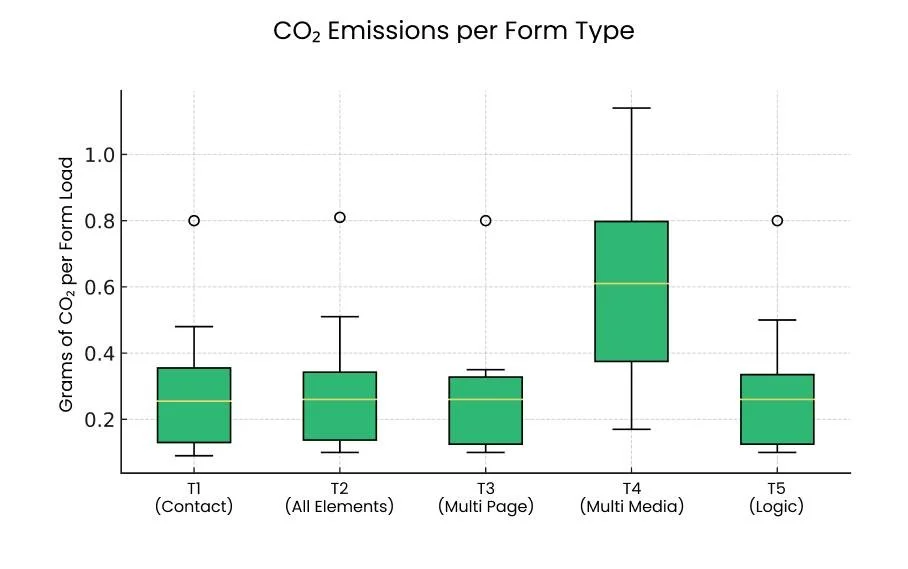
The figure above provides an answer to our first question: do form functionalities influence carbon impact. It shows the average carbon emissions for all form builders across the different form types. The median lines in our box plot clearly show that only media-related functionality significantly influence carbon footprint of web forms. In other words, only Type 4 forms performed differently across all form builders.

The figure above shows how our form builders compare when it comes to their emissions for "regular" forms (i.e. types 1, 2, 3 and 5) and "multi-media" forms (i.e. type 4). It's rather clear that for most form builders, the addition of multimedia elements to a form consistently increase energy intensity. In the case of Fillout the emissions almost quadruple. We assume that this is largely due to inefficient handling of images, for example lack of compression.
A notable exception to this trend is Typeform. Their forms have a consistent environmental impact across regular and multi-media forms. The bar chart also highlights the significant differences between form builders overall, which we discuss in more detail in the following section.
Ranking Form Builders from Most to Least Sustainable
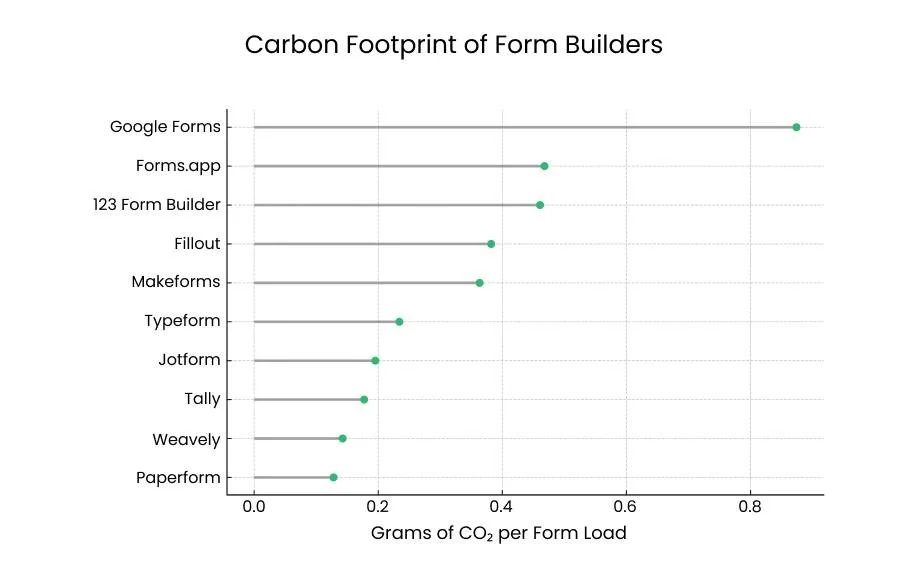
To fully compare the different tools we averaged their carbon emissions across all types of forms. The resulting ranking is shown in the figure above. Ranked from most sustainable to least sustainable:
The ranking clearly shows that not all form builders are created equal when it comes to carbon impact. A typical Google Form will consume three times more electricity than the equivalent form built in Paperform. Form builders can roughly be sub-divided into three categories. Top performers (i.e. Paperform, Weavely, Tally, Jotform and Typeform) emit around 0.2 grams of CO₂ per form load. Average performers (i.e. Makeforms, Fillout, 123 Form Builder and Forms.app) emit around 0.5 grams of CO₂ per form load. Finally Google Forms significantly underperforms by emitting around 1 gram of CO₂ per form load.
Comparing Website Carbon Calculators
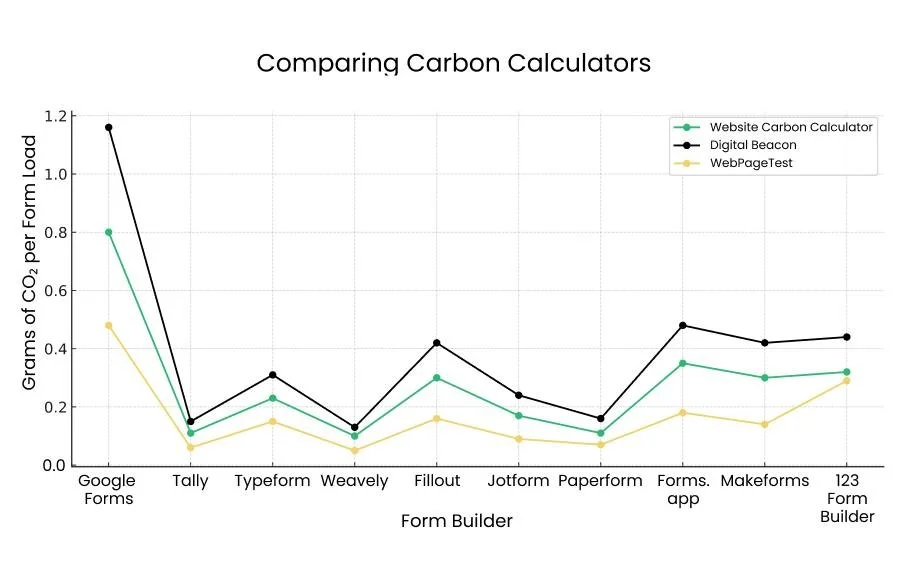
As an interesting side note to our main research, we also compared the estimates generated by the website carbon calculators. The figure above shows how each calculator estimates the carbon emissions for Type3 forms across the different form builders. Concretely, there are clear differences between the three tools. For example, Digital Beacon's estimates are significantly higher than for the other two calculators. However, the graph also clearly shows that the calculators are consistent in their estimates. For example, WebPageTest estimates carbon emissions consistently lower than the other two tools.
In other words, it's hard to rely on the absolute values estimated by these tools. However, you can definitely use them to compare website emissions.
Adding Perspective to the Data
A single form load may seem insignificant, but its overall impact on your digital carbon footprint adds up. For comparison, the average web page generates 0.8 grams of CO₂ per pageview. If you’re already working to reduce your website’s carbon emissions, choosing a sustainable form-building tool is just as important. Whether you’re collecting feedback or capturing leads, go green!
Guest post by Florian Myter

Florian Myter started his career as a computer scientist at the Vrije Universiteit Brussel and Ghent University in Belgium. After obtaining his PhD, he became a business developer for his research lab and helped bring research to market. He’s currently co-founder and CEO of Weavely.ai.